 Data is beautiful, there is no denying it. It might be hard to see this beauty when its in a JSON file or *shudders* an Excel spreadsheet, but data is immaculate. If you don’t believe me, check out a few of the examples from D3JS.org.
For me, one of the most exciting parts of the Leap Motion Controller is that it allows access to near-infinite data. I’ve talked with the ultimate homie Kai (who is responsible for this brilliant piece of dataVis) about this, and he made an analogy to the Leap Motion field being like a pool of data that you dip your hands into. I have always loved this analogy, mostly because a pool of data sounds refreshing.
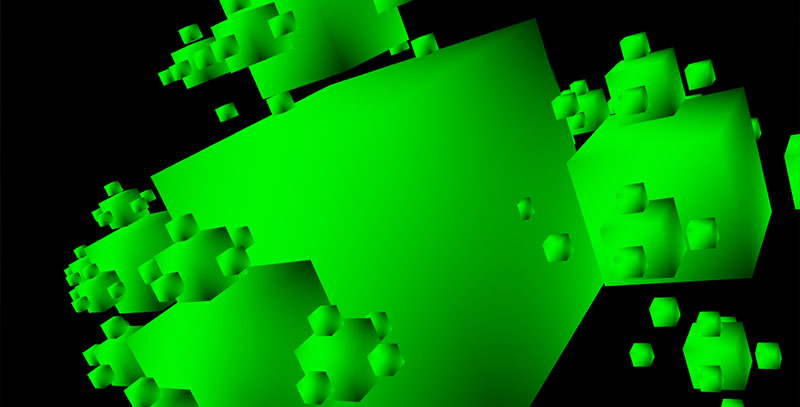
The manner in which you use this pool is totally up to you. But, as usual, the thing I want to do is make something that is beautiful, fluid, and totally useless (unless you think that feeling emotions like awe is useful). You can check out the data-pool-vis I’ll be talking about on my website. As usual, you’ll need WebGL to view this example.
I made this experiment after going through a few of the Learning WebGL tutorials, which you can find on Learning WebGL. If you’ve never tried out WebGL, this set of tutorials is extraordinarily lucid and easy to follow. I’ll try to explain how I’m doing everything from the tutorial, but if you have any questions, please let me know in the comments, via twitter @cabbibo, or icohen@leapmotion.com.
What’s so cool about a visualizer like this is that I honestly didn’t even remember what I had linked the visuals to when I started writing this post. I had only written it a week ago, but couldn’t for the life of me tell what I was doing when I first stuck my hands in the the pool. I do, however, know that my hands are there, and that they are doing something magical. This ‘unknowledge’ helps to create a sense of wonder, even when I’m using my own application.
(As usual, this might have to do with the fact that the demo was made between the hours of 3 and 5 in the morning, but I’d like to believe that part of it is because the data is so pure and deep, that it becomes too much for our fragile human minds to logically comprehend.)
After going through the code again, so that I could actually tell what I was doing, I saw that there are 4 parts of the Leap Motion Controller I was visualizing: the positions of 2 hands, and the palm normals of 2 hands. The spectacular part about this is that – although there are only 4 things being visualized – because each of those has 3 degrees of freedom, we suddenly have 12 variables to lavishly use in our visualization.
All of the actual drawing of the cubes comes from the recursive function found at line 475:

As you can see, it will draw a cube at the current scale and current position. This is done by pushing a Model View matrix, creating all of the sub objects by using the ‘drawCubes’ function at a newly defined size, and then popping that Model View Matrix. This means that if a subobject has more subobjects, the transformations will be done to the Model View matrix that corresponds to its parent object.
On line 493, you can see that the variable s is defined some parameters that are passed into the drawCube function, as well as a cryptically named ‘hA[i]’. This is the worst variable name I could possibly think of, and to be completely honest, I don’t know what I was even abbreviating. If there is one thing you should learn from this tutorial, it should be that abbreviating variable names is STUPID. Please never do it.
That being said, this is where the magic happens. Later on in the code (605 to be precise) we can see that in every frame, the array hA is defined as the positions of both of the hands. If a hand is not seen, its positions revert to 1,1,1 just so we don’t get errors. However, as soon as a hand is placed in the scene, we call a leapToScene function on the palmPosition, and use that new position as a variable that we use to draw the boxes.
Additionally in the Leap frame, we can see that if a hand is seen, we’re going to define a uniform for the shader program. By doing this, we can use the palm normals in our fragment shader, giving the user not only control of where all the blocks are, but additionally, what the faces of the blocks look like.
This may not seem like a lot of power. Indeed, there are so many more pieces of data we could visualize, that it feels slightly disrespectful to only use 4. It’s more of a puddle than a pool. That being said, these four pieces of data still make a user feel like they are in complete control of their computer. The visual is amazingly responsive, and although you may not be able to tell exactly what’s going on, it feels spectacular that something is happening, and that something is being defined by you, the user.
I hope to be publishing more sketches like this – exploring different beautiful ways to visualize the data from the Leap Motion Controller. In the meantime, let me know what you think about this visual, and what sorts of data you’re planning on visualizing in the comments. I’d love to help out and see what other people are creating.
— Isaac
TL;DR: data is beautiful, and don’t abbreviate variables.
A musician and creative researcher, Isaac explores the boundaries of space and sound with the Leap Motion JavaScript API. He has designed a variety of experimental interfaces that let you reach into music, big data, and even the fourth dimension.
